Lock Contention Profiling in Multithreaded C++ Services
Standard CPU profilers miss lock contention because they can't see blocked threads.

Advertisement
Lock contention profiling is a different discipline from ordinary CPU profiling, and treating it as the same problem is why so many multithreaded C++ services get misdiagnosed. The core issue: standard call-stack tools tell you which thread is waiting. Fixing contention requires tying wall-clock idle time back to the code path that held the lock, and that requires a measurement strategy built for the job.
Start with a distinction that gets collapsed too often: lock overhead and lock contention are not the same cost. Overhead is the pure mechanical cost of calling lock() and unlock() itself, paid regardless of whether another thread ever touches that mutex. Contention is what you pay only when a second thread wants the same lock at the same time and has to wait for it. A service can have trivial overhead and still be strangled by contention, because the two scale on entirely different axes: overhead scales with call frequency, contention scales with concurrent demand for the same resource. Conflating them is how engineers end up optimizing the wrong thing, shaving nanoseconds off a lock() call while threads sit parked for milliseconds.
What contention looks like at runtime is straightforward mechanically, and brutal in effect. Several threads try to acquire the same lock, one wins, the rest get parked by the OS. Parked threads don't burn CPU cycles, but they don't do useful work either. They just sit there. The net effect is serialization dressed up as parallelism: a 16-core box can end up doing the work of roughly one and a third cores, and every dashboard showing "16 threads running" is lying about what's actually happening under the hood.
The waiting mechanism itself changes what a profiler will show you. A mutex puts waiters to sleep, so it burns no CPU while waiting, but every wakeup costs a context switch, and a context switch runs into the thousands of clock cycles. A spinlock busy-waits instead, wasting cycles the whole time it's blocked, but it skips the context-switch tax entirely if the wait is short. That tradeoff isn't just a performance decision, it's a measurement decision: sleeping threads vanish from CPU samples entirely, while spinning threads stay visible in a profile but get their cost attributed to whatever code happens to be spinning, not to the thread that's actually causing the delay.
Why CPU profilers misread contention
CPU profilers work by sampling running threads. That's the entire mechanism, and it's also the entire blind spot. A blocked thread produces zero samples, because there's nothing running to sample. So a high-throughput service can show low, even healthy CPU utilization in a standard profiler while spending most of its actual wall-clock time parked in a kernel futex queue waiting on a lock. The profiler reports a quiet, underutilized system. The service, meanwhile, is almost entirely serialized behind one contended mutex. Those two pictures cannot both be right, and the profiler is the one that's wrong.
This isn't a new observation. Tallent, Mellor-Crummey, and Porterfield evaluated three separate strategies for attributing lock contention and found that plain call-stack profiling gives essentially no insight into where contention originates. The profiler shows you the victim, the thread that's waiting, never the perpetrator, the thread holding the lock too long. Their research also tested a middle approach, spreading blame across every thread holding a lock at the moment contention occurred, treating them all as "suspects." Their research also tested a middle approach, spreading blame across every thread holding a lock at the moment contention occurred, treating them all as "suspects," but that approach failed too. What actually worked was directly attributing the idle time of a spinning or blocked thread to the specific thread holding the lock at that moment, no suspects, no averaging, just a direct line from waiter to holder. That victim, suspect, perpetrator vocabulary is the precise language for picking a tool later in this piece.
Before reaching for any profiler at all, the system itself gives off signals. Symbols like __lll_lock_wait, futex_wait, pthread_mutex_lock, or __pthread_mutex_lock near the top of a profile are a tell. High %sys time paired with low throughput usually means futex contention is eating the run. And perf stat showing a high context-switch rate under otherwise steady load means threads are getting descheduled constantly, often because they're blocking on a lock. None of these localize the problem. They're triage signals, confirming something is wrong without saying where.
What a contention-specific measurement strategy needs to capture
An adequate contention profiler has to deliver three things, and dropping any one of them leaves a gap that gets filled with guesswork.
First, per-lock wait time: not a binary "is this contended" but a wall-clock number, how much time got burned waiting on this specific lock object. Second, attribution to the holder's call context, the code path that held the lock while waiters piled up, the perpetrator's stack, not the victim's. Third, a separation between contention count and wait time, because a lock acquired millions of times with negligible waits each time can be far less damaging than one acquired rarely but held for a long stretch. Both numbers matter, and neither substitutes for the other.
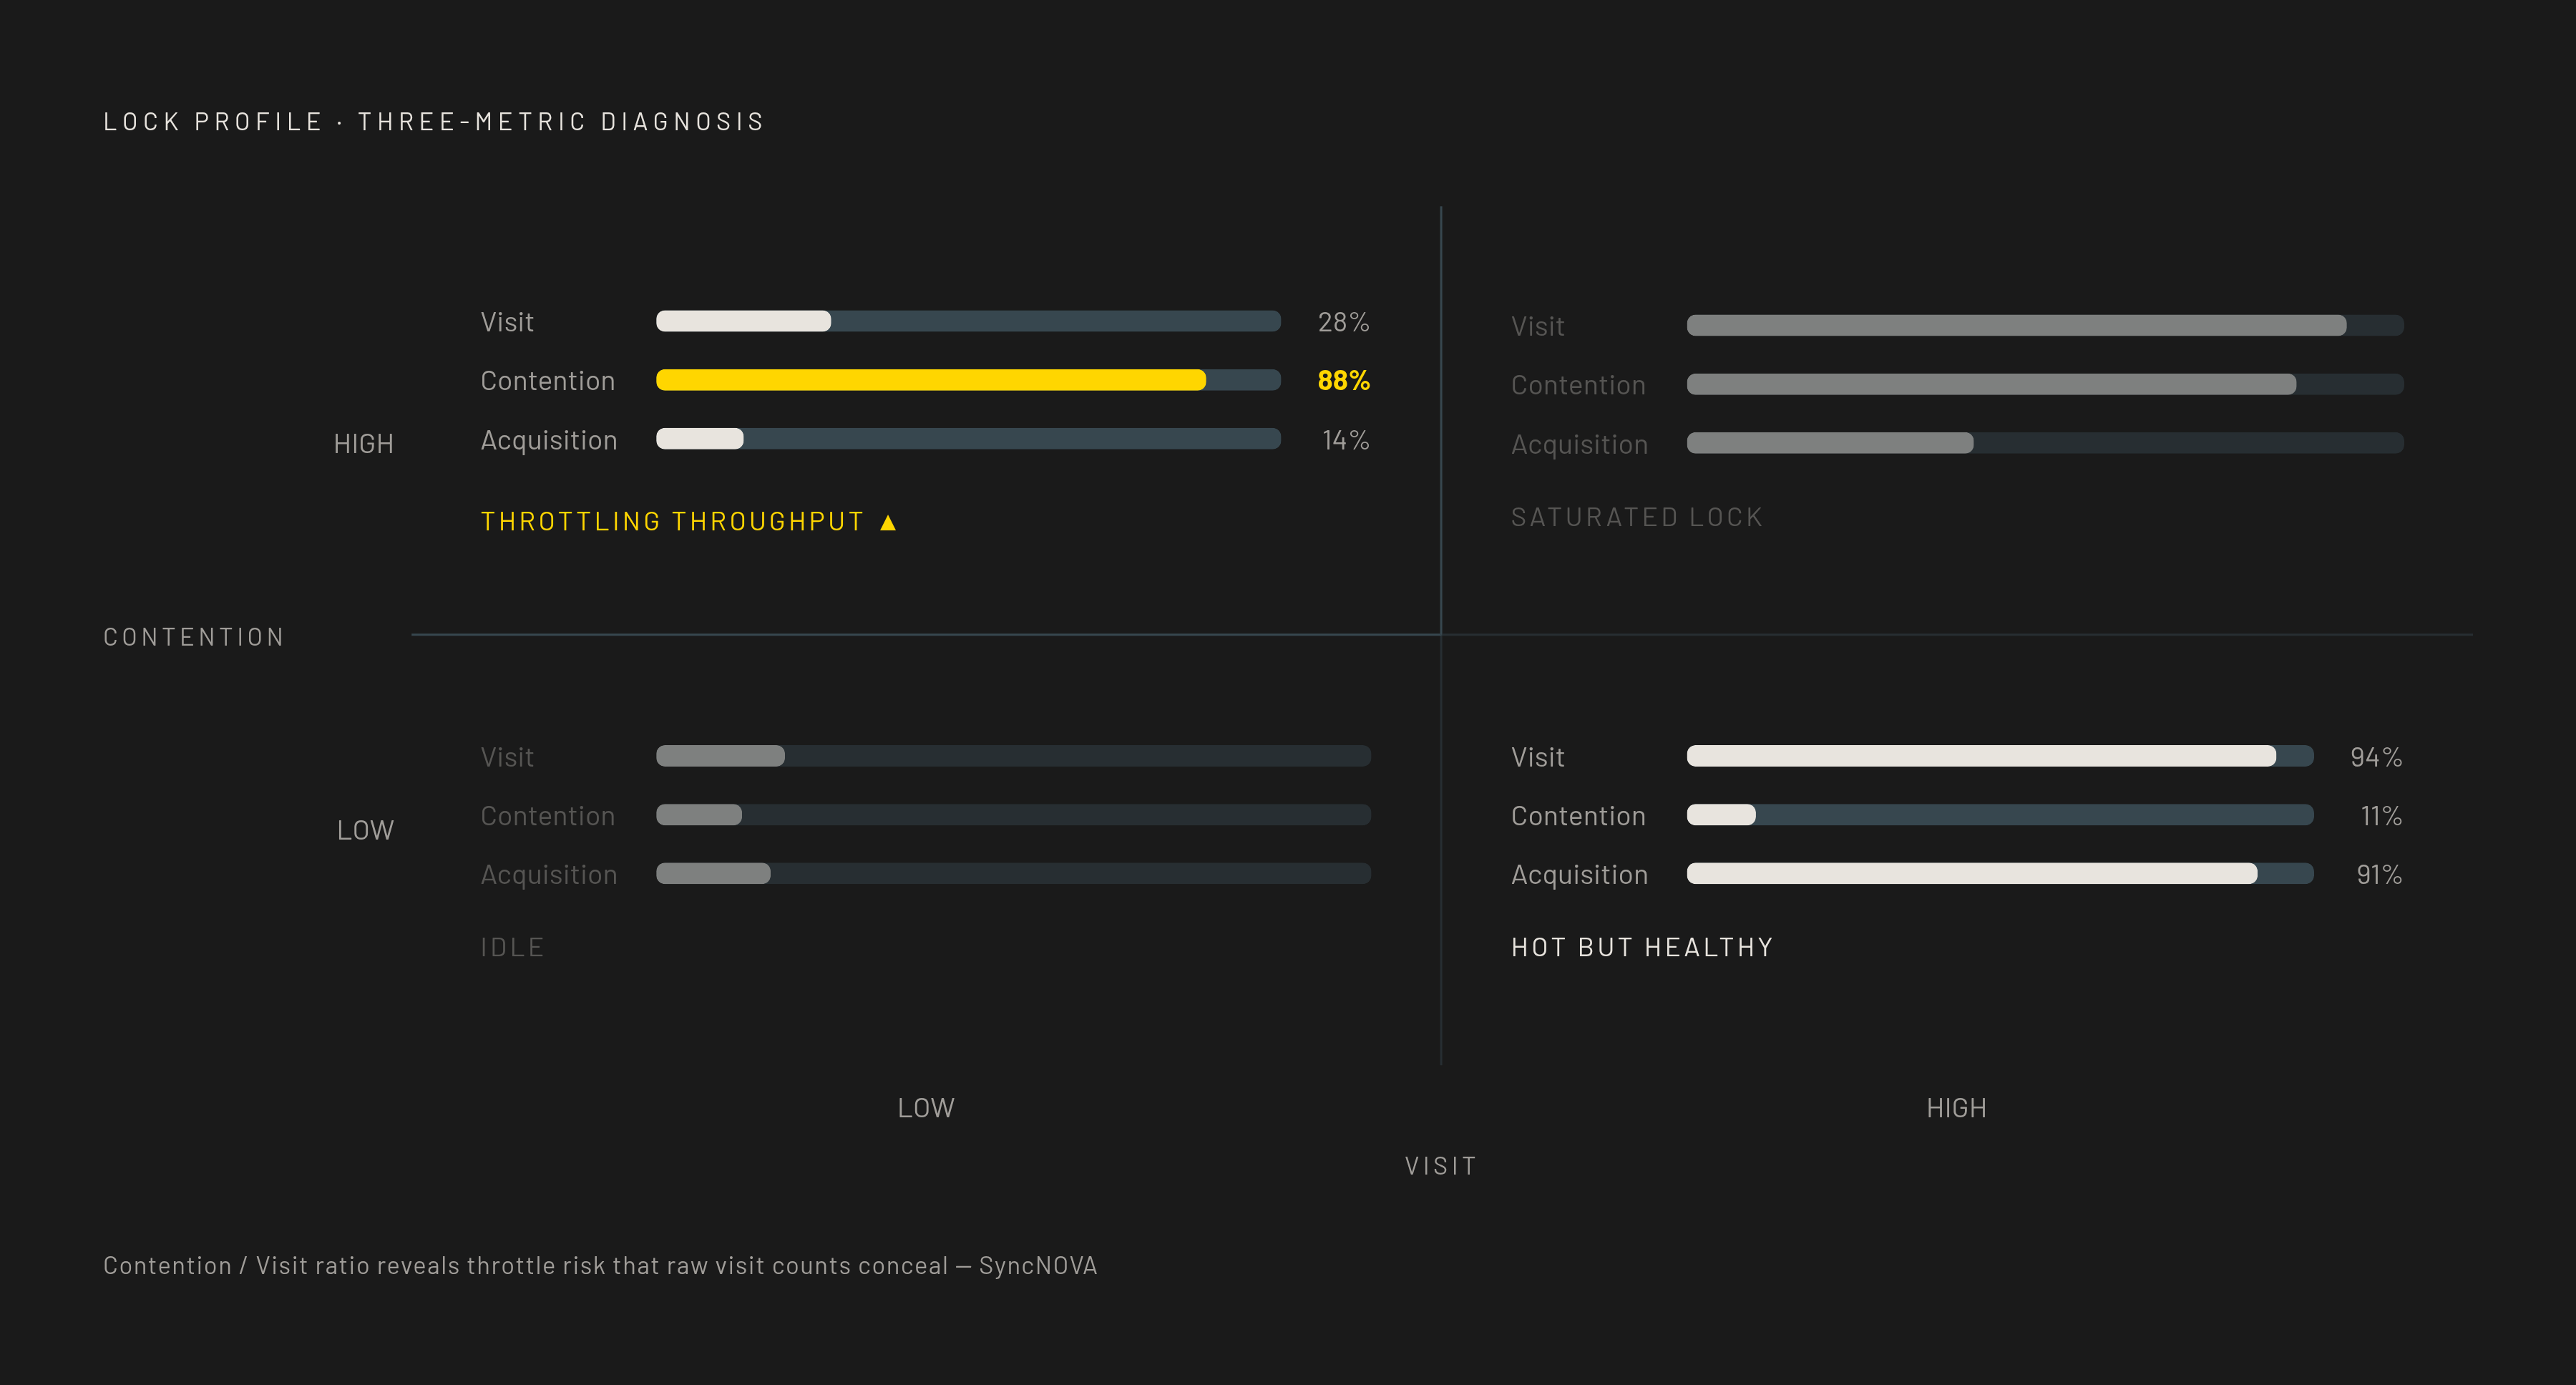
SyncNOVA's per-lock metric vocabulary is a useful reference point for what this looks like in practice: visit tracks total access count (a high value flags a hot spot), contention tracks how often threads actually collided on the lock (a high value flags a throughput bottleneck), and acquisition tracks successful lock grabs. Read in isolation, any one of these can mislead. A lock with high visit and low contention is busy but not a problem. A lock with modest visit and high contention relative to that visit count is a different animal entirely, and only seeing all three together tells you which one you're looking at.
There's a constraint that's easy to overlook: any tool that adds overhead inside a critical section becomes a new source of contention, which corrupts the very thing it's trying to measure. HPCToolkit's approach is a useful benchmark here, holding overhead to 5% or less on a quantum chemistry workload involving a large number of distinct locks, a peak of 340,000 live locks at once, and an average of 30,000 lock acquisitions per second per thread. That's the order of scale a serious profiler has to survive without distorting the measurement. Oddly, overhead added outside the critical section can also skew results, just in the other direction: it slows down the rate at which threads even attempt to acquire the lock, which can make contention look lower than it actually is under normal load. And any tool worth using has to hold up as core counts climb. A profiler that works cleanly on a two-thread test case and falls apart at sixteen or sixty-four threads isn't measuring the problem most production services actually have.
The tool landscape: matching instrument to measurement goal
perf lock contention, on Linux, optionally backed by eBPF, is close to the sharpest command-line instrument available for this. It traces locking behavior in-kernel and reports per-lock acquire counts, contention counts, and total wait time. Sort that output by wait time and the worst offender appears immediately, which is about as close to a direct perpetrator view as a command-line instrument gets. Off-CPU flame graphs, using an eBPF-based profiling tool from one tracing toolchain, complement this well: a stack ending in futex_wait is contention wearing a different label, and the flame graph makes the holder's calling context visible in a way raw numbers don't. A patch series is adding lock-owner call-stack tracing directly to perf lock contention. The owner-tracking flag (-o) can be paired with per-thread stats (-t) or with -v to print the owner's stacktrace. Once merged, that closes the attribution gap almost entirely at the command line.
Intel VTune Profiler takes a GUI-driven route to the same problem through its Threading analysis, which folds in what used to be separate Concurrency and Locks and Waits analysis types. It shows how efficiently a run uses available cores and flags inefficiencies in synchronization, down to which thread waited on which object and for how long. VTune relies on user-mode sampling and tracing, with Effective CPU Utilization as its headline efficiency metric, and its CPU Metrics Reference tracks Lock Contention explicitly alongside Thread Concurrency, Wait Count, and Wait Rate. For teams that want holder and waiter context in one screen without stitching together command-line output, VTune is a strong fit.
Valgrind's Helgrind and DRD belong to a different category. Helgrind catches data races, lock-ordering problems that could deadlock via cyclic dependencies, and misuse of the POSIX pthreads API. DRD catches races, improper pthread use, false sharing, deadlock, and monitor lock contention, but it can't detect the wrong lock order the way Helgrind can. Neither is built to quantify wait time. They tell you what's wrong and where the logic breaks, not how expensive the breakage is in wall-clock terms.
ThreadSanitizer occupies the fast-and-first-line slot in most CI setups now. It's a compiler and runtime tool for race detection, running roughly 5x to 15x slower than native and using something like 5x to 10x more memory, both real costs but far more tolerable than Valgrind's thread analysis overhead. Helgrind and DRD haven't gone obsolete, though. They still earn their place on legacy binaries and in specific synchronization investigations where TSan instrumentation isn't an option.
False sharing: contention without a lock
False sharing produces every symptom of lock contention without a single mutex involved, and it's one of the more common false leads in this kind of investigation. CPUs don't fetch memory variable by variable, they fetch it in cache lines, typically 64 bytes wide on x86. If two threads write to two different variables that happen to land on the same 64-byte line, the cache coherence protocol treats that as a conflict, and the line bounces between cores even though the threads never touch the same data. The mechanism here is MESI (Modified, Exclusive, Shared, Invalid): thread one updating variable x and thread two updating variable y, sitting on the same line, each invalidate the other's cached copy, and the result is constant cross-core traffic over data that was never actually shared.
It gets misdiagnosed as lock contention constantly, because the symptoms match almost exactly: high %sys, elevated context-switch rates, poor scaling as core count goes up, all without an explicit mutex anywhere in the hot path. The diagnostic tell is that false sharing happens with no locking present. And it survives naive fixes, too. Splitting one mutex into two separate mutex objects reduces logical contention, but if those two mutexes still run on the same cache line, the physical bouncing continues exactly as before.
The cost of this is not trivial. In one two-thread example, eliminating false sharing brought benchmark time down from 1,526 microseconds to 460 microseconds, roughly a threefold improvement on a minimal test case. The C++17 fix is a one-line change: alignas(std::hardware_destructive_interference_size), which on many x86 systems works out to alignas(64), though the exact value is implementation-defined (Apple's M1 and M2 chips use 128, for instance). That padding forces structures onto separate cache-line boundaries, requiring no change to program logic. It isn't free, though. A 32KB L1 cache holds far more tightly packed integers than padded ones, so alignment shrinks effective cache capacity, and it's worth applying only where profiling has actually confirmed false sharing is the problem, not as a reflexive defense. Practically, after localizing a hotspot with perf lock or VTune, check whether the lock objects themselves are cache-line aligned before concluding the mutex logic itself is at fault.
Turning profile data into a localized diagnosis before touching the code
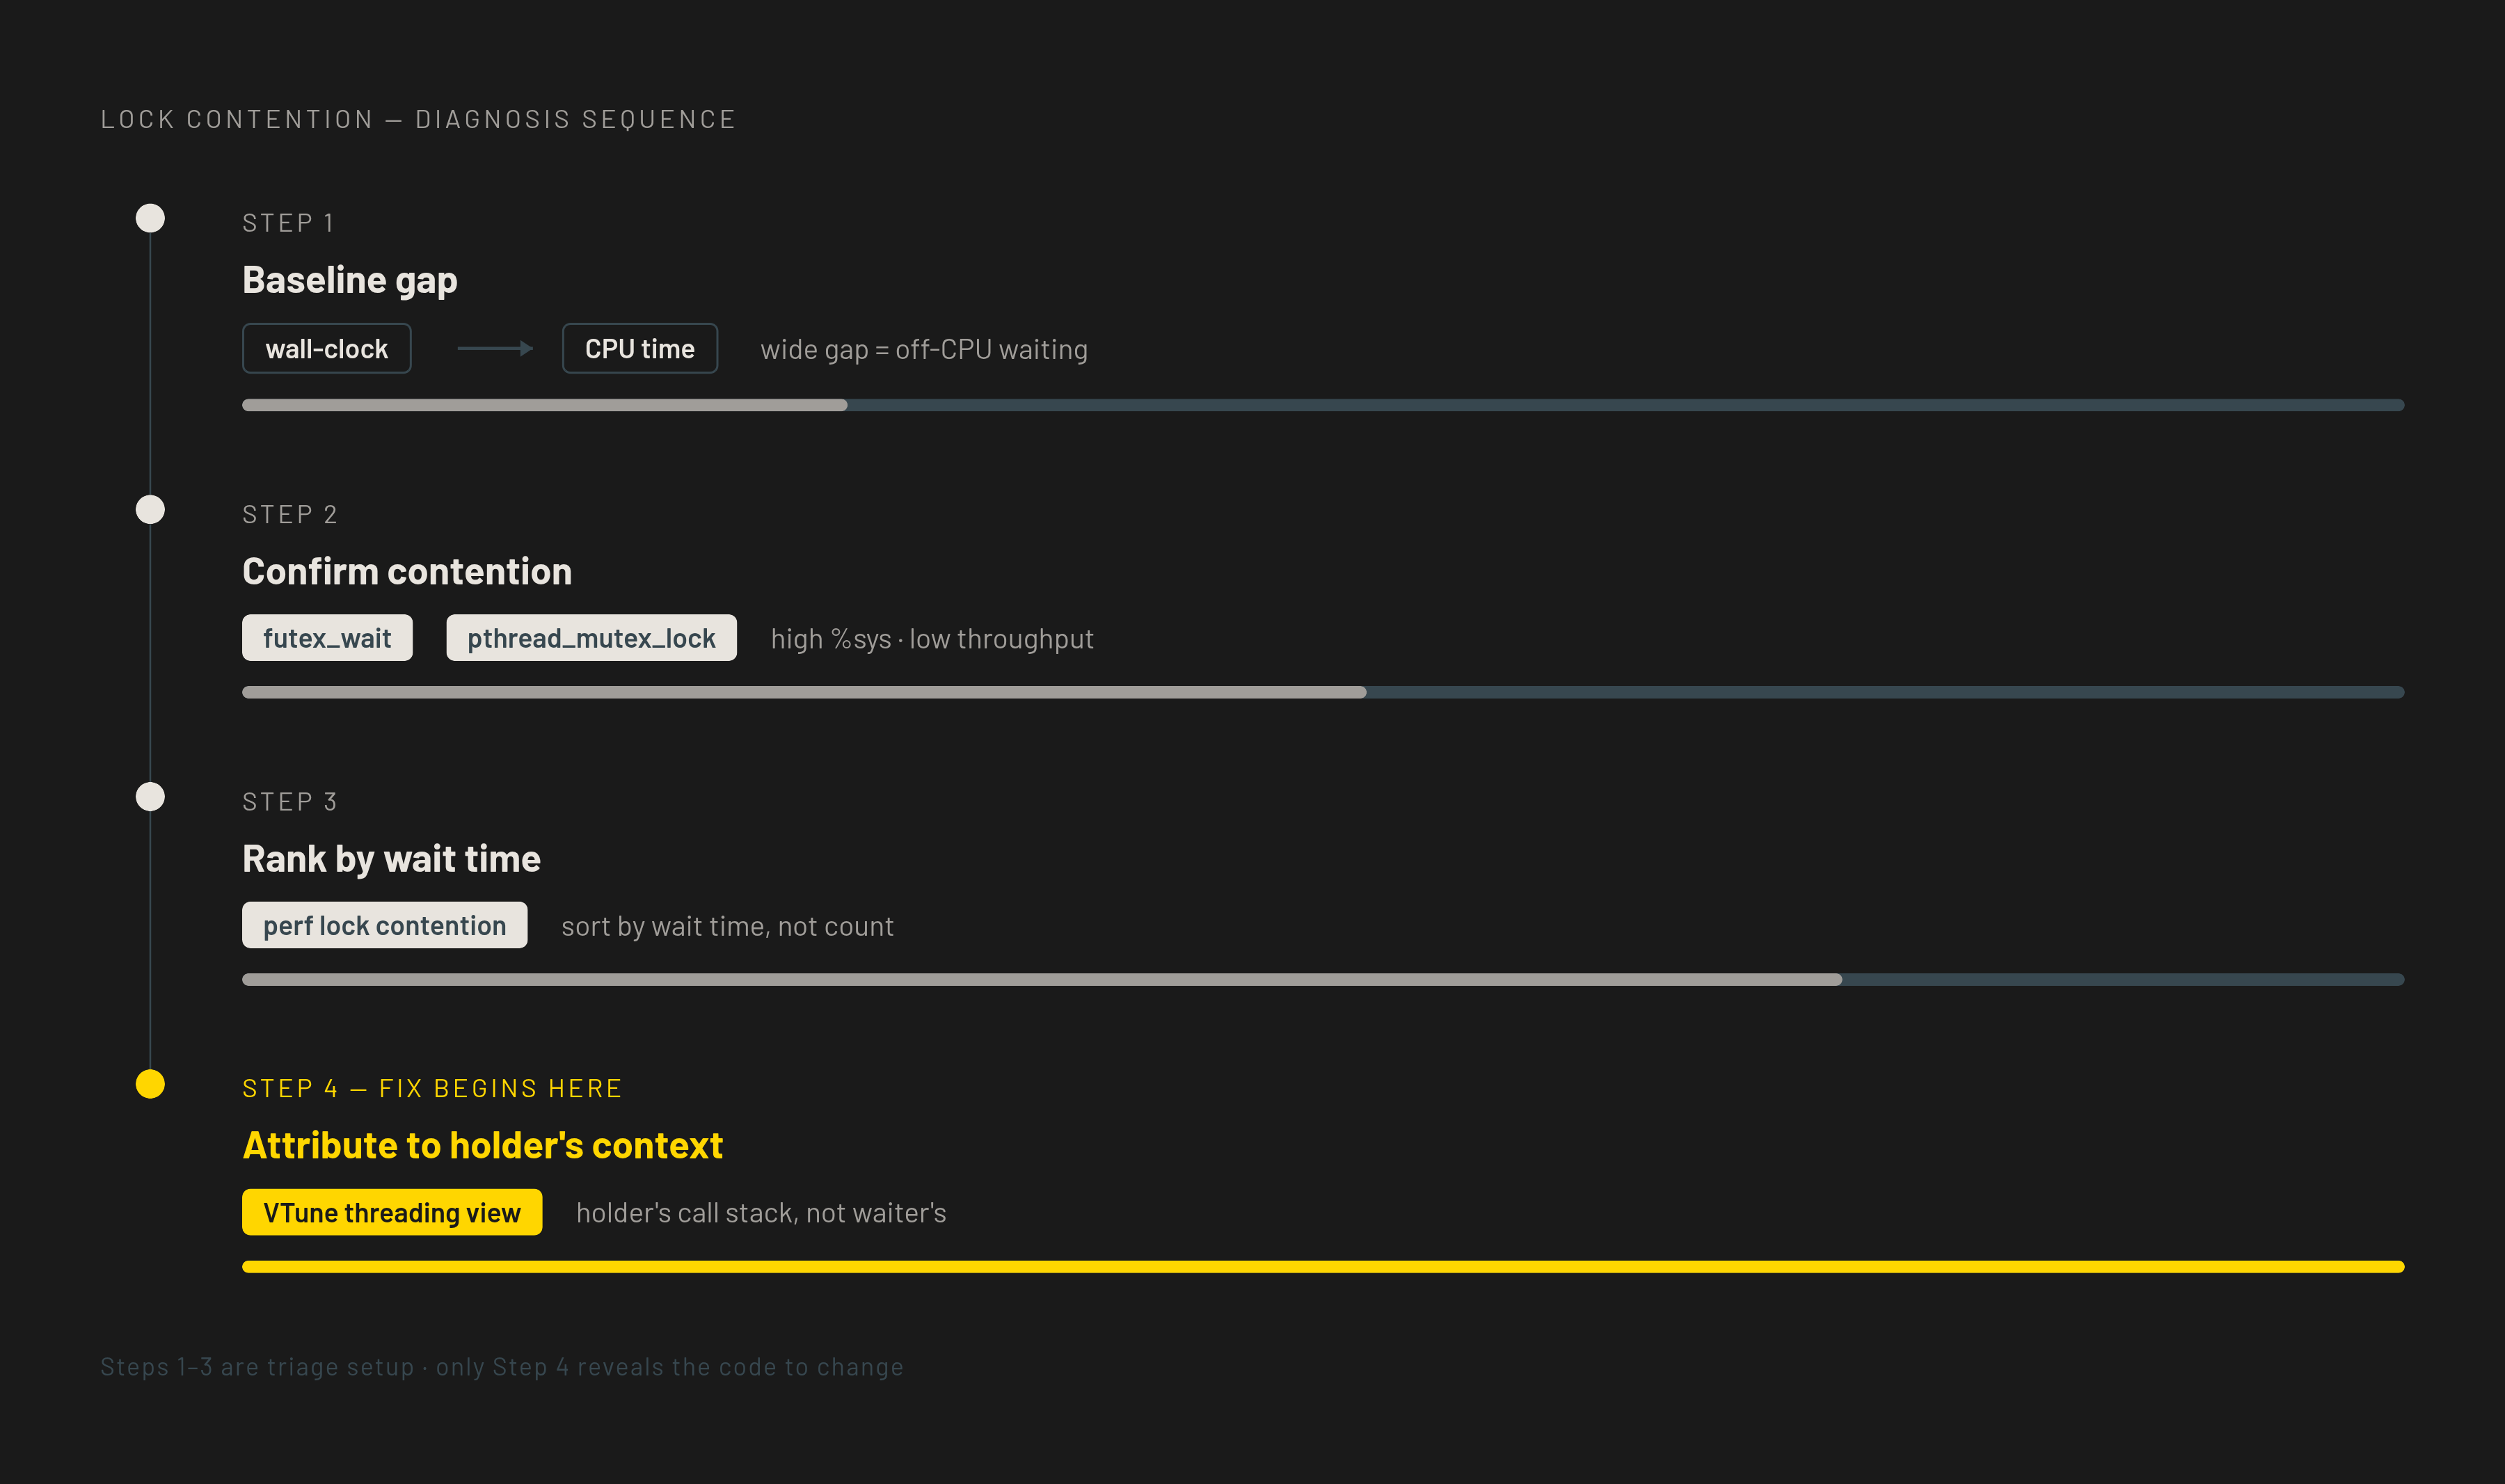
The first step is establishing a baseline: how far apart are wall-clock latency and actual CPU time consumed. A wide gap is the first quantitative sign that off-CPU waiting, not computation, is eating the budget. Checking perf stat for a high context-switch rate under steady load belongs here too, before reaching for anything heavier.
Second, confirm contention is actually the cause rather than a plain CPU bottleneck. Symbols like futex_wait, __lll_lock_wait, or pthread_mutex_lock appearing in the profile confirm threads are sleeping on locks, not grinding through computation. High %sys paired with low throughput backs that up.
Third, rank the lock objects by total wait time, not by how often they were contended. perf lock contention sorted by wait time will put the worst offender at the top. A lock contended constantly but only for microseconds each time can matter less than one contended rarely but held for whole milliseconds, so wait time, not raw contention count, has to be the sorting key.
Fourth, attribute that wait time to the holder's call context rather than the waiter's. This is where VTune's threading view earns its keep, because it is built to answer exactly this question: not who was idle, but who kept them that way. Only once that call path is identified, the specific function holding the lock across the expensive stretch, does the diagnosis actually point anywhere useful. Everything before that step is triage. This step is the localization the entire measurement strategy has been building toward, and it's the point where a fix, rather than a guess, becomes possible.
Sources
- Analyzing lock contention in multithreaded applications | Proceedings of the 15th ACM SIGPLAN Symposium on Principles and Practice of Parallel Programming
- cs.rice.edu
- (PDF) Analyzing Lock Contention in Multithreaded Applications
- brendangregg.com
- intel.com
- dev.to
- en.cppreference.com
- GAPP: A Fast Profiler for Detecting Serialization Bottlenecks in Parallel Linux Applications